
Mormonism Explained
Faith & Data · The Outcomes Record · Annual Study
Mormonism: By the Numbers.
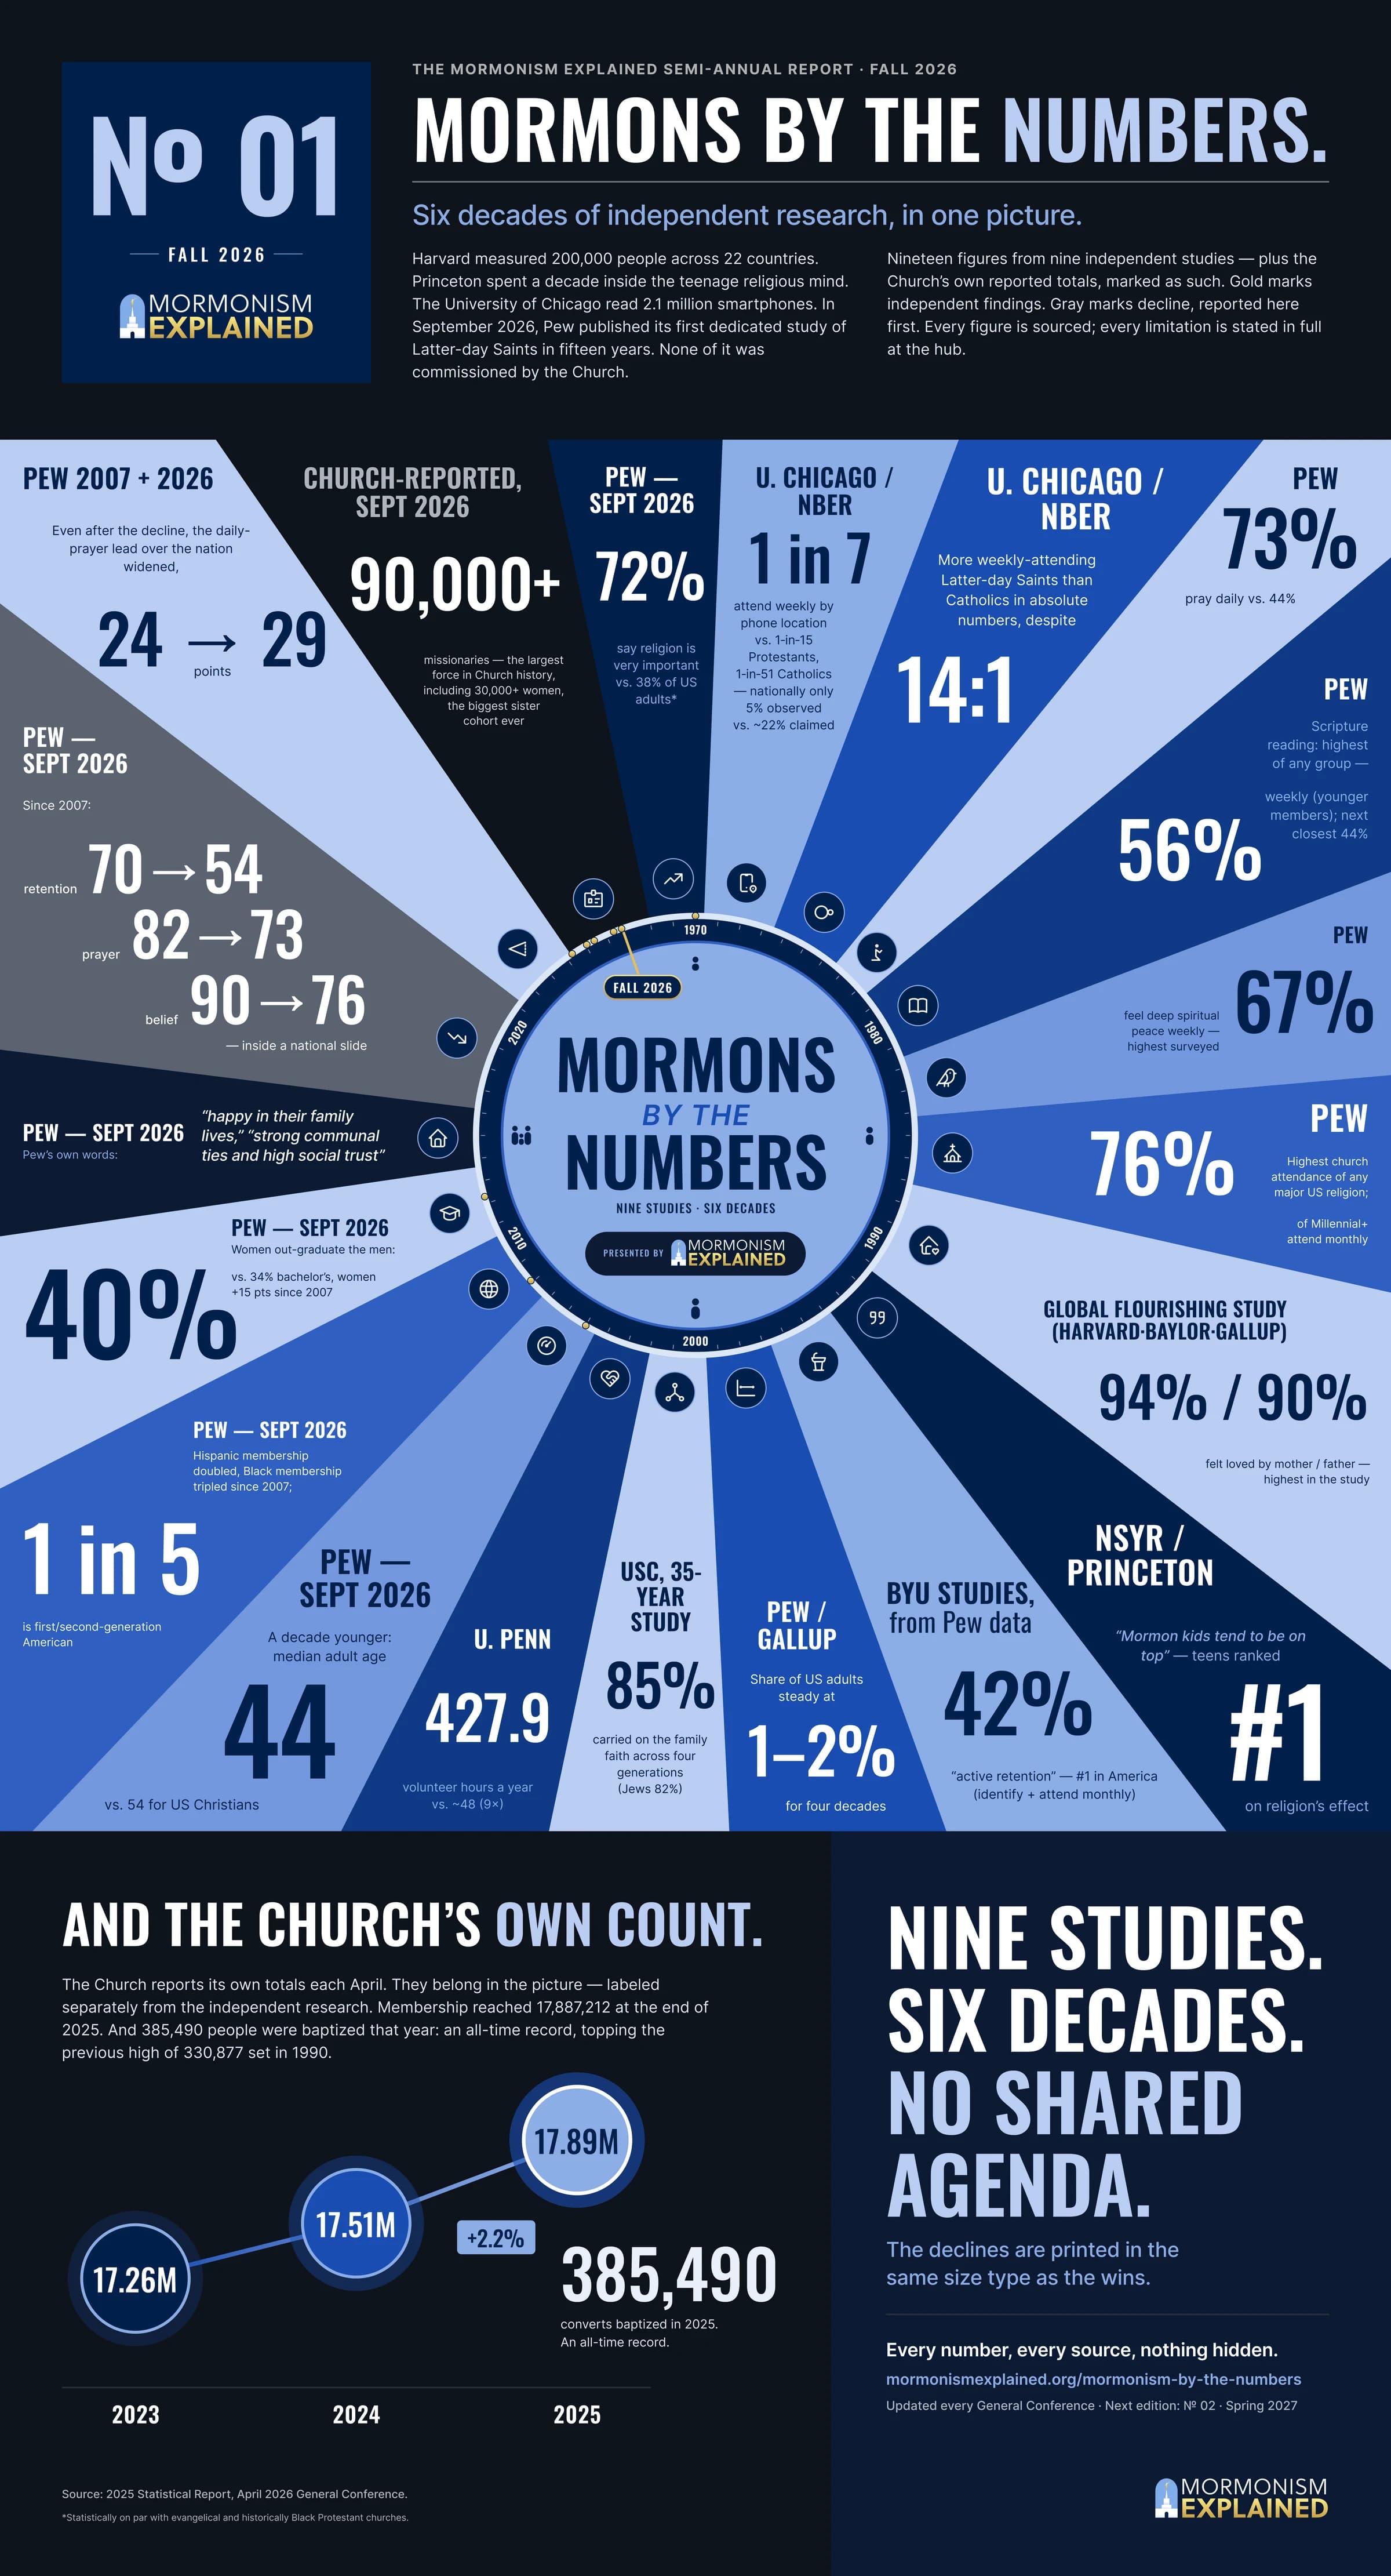
Harvard measured 200,000 people. Princeton spent a decade inside the teenage religious mind. Penn counted the volunteer hours. USC tracked four generations for 35 years. Pew has asked for two decades. This is every major independent dataset on Latter-day Saints — the numbers, the sources, the limits, and the pattern that keeps repeating.
The Short Answer
When independent researchers measure Latter-day Saints — happiness, mental health, family closeness, teenage faith, young-adult retention, generosity, generational transmission — the same result keeps surfacing at or near the top of the charts. Not from one study that could be a fluke, and not from the Church’s own research: from Harvard’s Global Flourishing Study, Princeton’s analysis of the National Study of Youth and Religion, Notre Dame’s young-adult follow-ups, Pew’s Religious Landscape surveys, the University of Chicago’s two-million-phone geolocation analysis, the University of Pennsylvania’s volunteerism research, USC’s 35-year generational study, and BYU’s population-scale youth mental-health work, independently replicated at Bowling Green.
The honest limits are real and stated throughout — averages aren’t guarantees, correlation isn’t causation, retention has genuinely declined from its 1980s peak, and the global data carries a real health-axis nuance. But the direction of the evidence is among the most consistent findings in the sociology of American religion. This page compiles all of it.
Dashboard
The Compiled Record
Weekly worship — highest measured
GFS
Depression, vs. 16–19%
GFS
“Highly happy”
GFS
Felt loved by mother / father
GFS
Active retention, #1
Pew / BYU Studies
Daily prayer, vs. 44%
Pew
Religion very important, vs. 38% — top of the chart
Pew, Sept 2026
Observed weekly attenders
U. Chicago
Volunteer hours, vs. ~48
Penn
Family-faith transmission
USC
One life, four datasets
Loved children — 94%
Felt loved by their mother (Global Flourishing Study)
Teens — #1
Ranked first on religion’s effect on their lives (NSYR)
Active retention — 42%
Still identifying and attending monthly (Pew / BYU Studies)
Volunteering — ~9×
427.9 hours a year vs. ~48 (Penn)
Summary below the data. These aren’t eight versions of one survey — they’re eight instruments built by different institutions, aimed at different ages, using different methods: a 22-country panel, a national teen study with in-person interviews, a decadal household census of American religion, a ward-level count of volunteer hours, a four-generation family study. Stack them chronologically and they stop reading like separate findings and start reading like one longitudinal story: loved children become articulate teens, who become retained adults, who raise the next set of loved children. The studies are independent. The life they describe is one life.
The How-Many-Left Study — Accounting for Mortality
No question about the Church gets argued with worse math. Viral estimates of “people leaving in droves” usually start from composition change — the share of Americans identifying as Latter-day Saints — and treat every missing percentage point as a leaver. That method is broken three ways, and the first is the one almost nobody adjusts for: mortality. A denomination’s identifiers decline every year simply because members die; deaths are not departures. The other two: composition math ignores converts coming in, and it ignores leavers who later return — and in the survey data, roughly two in three who step away say the door isn’t closed.
- 1980s (GSS)82%
- 2007 (Pew)70%
- 2014 (Pew)64%
- Sept 2026 (Pew official)54%
- Active retention42%
The 2025 LDS Religious Seismology Survey independently landed near the same level (~50%).
- Latter-day Saints (Pew official, Sept 2026; statistical tie with Baptists)54%
- Baptists54%
- Lutherans47%
- Methodists37%
- Presbyterians30%
Note: comparing to “all Protestants” pooled (71%) is a category error — a pooled label absorbs switching between its own denominations. (Dyer, Aug 2026)
- Latter-day Saints42%
- Muslims38%
- Nondenominational28%
- Hindus28%
Pew Religious Landscape Study 2023–24, via BYU Studies
Summary below the data. Retention has genuinely declined, and Pew’s September 2026 study puts the official trendline on the record: 82% in the 1980s (GSS), then 70% in Pew’s 2007 survey, 64% in 2014, and 54% today — with 28% of adults raised in the faith now religiously unaffiliated, double the 2007 figure. Disaffiliation runs higher among younger cohorts and, notably, younger women. We report all of that plainly because the comparative context is what makes it meaningful: the same decades gutted nearly every American tradition. On raw retention, Latter-day Saints today are in a statistical tie with Baptists — the highest-retaining Protestant denomination — and ahead of every other Protestant denomination, while trailing Hindus, Muslims, Jews, Orthodox Christians and Catholics. On active retention, they’re first in the country at 42% — a different, stricter metric than raw retention, and never a rebuttal of it. Pew also notes it cannot yet tell whether Latter-day Saint religiousness has stabilized since 2020 the way the nation’s has; its samples between landscape studies are too small. Pew measures the LDS share of US adults as roughly stable near 2% since 2007, with the 2014→2024 change not statistically significant — while Baptists, Presbyterians, and Methodists each declined more than 20%. And of those who do leave: 54% still call religion or spirituality important, and about two-thirds leave open the possibility of returning. The strongest measured predictors of leaving aren’t scandal or doctrine — they’re not feeling God’s presence in daily life, and political ideology, the same two forces reshaping every American faith.
Study 01 · Verified
The Global Flourishing Study (Harvard/Baylor/Gallup, 2024–26)
The biggest instrument ever pointed at the question: 200,000+ adults, 22 countries, nationally representative, resurveyed annually — Wave 3 released March 2026. Flourishing measured across happiness, health, meaning, character, relationships, and financial stability, combined into a single index.
- Latter-day Saints65%
- Evangelical59%
- Pentecostal53%
- Baptist45%
- Presbyterian37%
Global Flourishing Study, US data
- Highly happy: Latter-day Saints30%
- Highly happy: No religion16%
- Highly happy: Never religious11%
- Depression: Latter-day Saints8.5%
- Depression: No religion16%
- Depression: Never religious19%
Global Flourishing Study, US data
- By their mother94%
- By their father90%
Global Flourishing Study, US data
Summary. On the combined flourishing index, US Latter-day Saints landed in the top tier, statistically tied with several other religious groups; the lowest flourishing belonged to the “never religious.” Note the precision: not sole first place — a tie at the top, and the tie is the finding. Worldwide, greater attendance predicted greater flourishing across all 22 countries, including secular societies — the strongest available answer to “it’s just correlation.” One nuance we report before anyone asks: globally, Latter-day Saints score highest of any religion on meaning and purpose but weaker on the combined mental-and-physical-health axis. The US picture and the global picture are not identical.
Study 02 · Verified
The NSYR Trilogy (Princeton/Notre Dame, 2005–2010)
The National Study of Youth and Religion: 3,290 surveyed teens and parents, 267 in-person interviews, 45 states, longitudinal follow-ups. Its famous diagnosis (Soul Searching, Oxford, 2005): most American teens practice “Moralistic Therapeutic Deism” — vague, feel-good, doctrinally empty.
- Weekly faith talk80%
- Parent-similar views73%
- Fasting / self-denial68%
Ledger-flagged until pinned to book pages
Summary. Latter-day Saint teens ranked first on the overall effect of religion in their lives; Christian Smith told the Church News in 2005, “Mormon kids tend to be on top,” crediting a religion that asks more of its youth. Five years later, Kenda Creasy Dean — Princeton Theological Seminary professor, ordained Methodist minister, an NSYR researcher — wrote Almost Christian (Oxford, 2010) for her own tradition, and Chapter 3 is literally titled “Mormon Envy: Sociological Tools for Consequential Faith.” Publishers Weekly called it an admiring chapter-length case study. The follow-up, Souls in Transition (2009), reframed the young-adult “cliff”: the college faith-collapse is greatly exaggerated, parents are the single most important influence on young-adult religious outcomes, and Latter-day Saint young people stood apart from the broader decline.
Study 03 · Verified
Pew Religious Landscape Study (2007/2014/2023–24) + “Tradition and Change” (Sept 2026)
Random household sampling reaching ~90% of US addresses, n≈35,600.
- Religion very important: Latter-day Saints — top of the chart72%
- Religion very important: national38%
- Daily prayer: Latter-day Saints73%
- Daily prayer: national44%
- Weekly scripture reading: Latter-day Saints (highest)56%
- Weekly scripture reading: Evangelicals44%
- Weekly spiritual peace: Latter-day Saints (highest)67%
- Monthly+ attendance, Millennial+ Latter-day Saints (CES 2008–24)70–90%
The 72% is statistically on par with evangelical and historically Black Protestant churches.
Updated — September 2026. Pew’s new dedicated study (report PDF) — its first on Latter-day Saints since 2011–12 — reconfirms every figure above and adds to the record. The highs: 72% say religion is very important in their lives, nearly double the national 38% and top of Pew’s chart (statistically on par with evangelical and historically Black Protestant churches); Pew’s own section findings describe members as “happy in their family lives,” with “strong communal ties and high social trust”; the median Latter-day Saint adult is a decade younger than American Christians overall (44 vs. 54); Hispanic membership has doubled and Black membership tripled since 2007; and Latter-day Saint women now out-graduate the men (40% vs. 34% bachelor’s, women up 15 points since 2007). The declines, stated just as plainly: since 2007, daily prayer is down 9 points (82% → 73%) and certain belief in God is down 14 (90% → 76%) — inside a national slide moving the same direction. Even after that decline, the daily-prayer lead over the national average widened, from 24 points to 29. Retention gets its full accounting in the how-many-left section.
Summary. Highest church attendance of any major US religion; 76% of Millennial-and-younger members attending at least monthly; 80% of Latter-day Saint parents praying or reading scripture with their children — the highest of any religion measured. A second independent academic instrument — the Cooperative Election Study, 91,231 Latter-day Saint respondents across its 2008–2024 waves — lands on the same pattern: 70–90% of Millennial-and-younger members report attending at least monthly. Both are self-report surveys, and self-report has a known problem. The hardest check on it gets its own section next.
Study 04 · Verified
Where Feet Actually Go (U. Chicago / NBER Working Paper 32334, 2024)
Smartphone geolocation for 2.1 million Americans checked against ~480,000 places of worship across 2019 — attendance measured by where phones physically went, not what people claimed.
Concede first, because it applies to us: only ~5% of Americans attend weekly by observation vs. ~22% self-reported; the gap exists in every tradition, ours included (~15% of US Latter-day Saints observed weekly, roughly a third of self-report).
- Latter-day Saints — 1 in 7~15%
- Protestants — 1 in 15~7%
- Catholics — 1 in 51~2%
“Weekly” = ≥36 of 47 sample weeks.
Summary. By the hardest yardstick anyone has built, Latter-day Saints and Jehovah’s Witnesses are the most likely weekly attenders in America. Catholics outnumber Latter-day Saints ~14 to 1, yet there are slightly more weekly-attending Latter-day Saints than Catholics in absolute terms (0.20% vs. 0.17% of all Americans). Utah ranks highest of all fifty states for observed attendance. Limits stated: 2019 pre-pandemic data; phones-at-home and building-coverage critiques answered publicly by Pope but not eliminated; Orthodox Jews undercounted. Latter-day Saints lead even after their own self-report gap is subtracted.
Study 05 · Verified
Youth Mental Health (BYU Studies Quarterly 2022; replicated at Bowling Green)
The 2019 Utah Prevention Needs Assessment: population-weighted, anonymous, 86,346 students in grades 6/8/10/12 (Dyer, Goodman & Wood, BYU Studies Quarterly 61:3, 2022).
- Latter-day Saints4%
- Protestant9%
- Catholic10%
- None11%
- Other13%
Dyer, Goodman & Wood, BYU Studies Quarterly 61:3 (2022); n=86,346
- LGBQ Latter-day Saint youth~10%
- LGBQ youth, no religion21%
Lowest of any religious group, holding after controls
Summary. Every other group measured significantly higher than Latter-day Saint youth — on attempts, on serious consideration, and on depression. Longitudinally, religious practice associated with lower depression across ages 12–18, and temple attendance at 16 predicting reduced depression at 18. Two bounds, stated at full strength: elevated risk among LGBQ youth is real in every group including ours — the finding is relative safety, not absence of struggle — and a 2015 convenience-sample survey of 1,612 LGBTQ current and former members found the opposite direction; it sampled self-selected respondents rather than a weighted population, which is why the population studies carry more evidentiary weight, but we name it rather than pretend it doesn’t exist. Mechanism identified by the researchers: close family connection. Full treatment in our dedicated LGBTQ youth-safety study.
Study 06 · Verified
Families and Faith (USC, 1970–2005)
The Longitudinal Study of Generations: 350+ multi-generational families, 2,000+ respondents, up to four generations across 35 years (Bengtson, Putney & Harris, Oxford, 2013).
- Latter-day Saints85%
- Jews82%
- Evangelicals~60%
- Mainline~30%
LDS rose from 67% in 1970. Bengtson’s caveats travel with the number: small LDS subsample; wording permitted identification without active practice.
Summary. High-boundary faiths transmit best; transmission runs through warmth — especially a father’s warmth, and grandparents who reinforce the parents; religion embedded in daily family activity beats religion outsourced to professionals; Family Home Evening named as the exemplar practice. This study is the causal bridge of the whole record: Harvard’s loved children, Dean’s articulate teens, Pew’s retained adults — Bengtson’s four generations show the conveyor belt connecting them.
Study 07 · Verified
Called to Serve (U. Penn, 2012)
First academic study inside LDS wards by a non-Church-affiliated university: 2,664 active members across PA/NJ, Michigan, Utah, California; Penn-funded (Cnaan, Curtis & Evans).
- Active Latter-day Saints427.9
- — of which community / social~152
- US average~48
Estimated value ~$9,140/yr
Summary. Penn’s own summary called Latter-day Saints the most “prosocial” members of American society, generous regardless of geography. Bounds stated plainly: the sample is active members by design — which measures exactly what the practice produces, and we say so — hours are self-reported, and the fieldwork is from 2012.
Why the Pattern Holds — Steelman — Verdict
Why it holds. Seven institutions found one pattern because they were measuring one life from different angles: a family trying, daily, to live the gospel of Jesus Christ together. The researchers’ own explanations converge on the home — family prayer and scripture morning and night, weekly covenant renewal at the sacrament table, teenagers trusted with real discipleship rather than programming, and households wrapped in ministering adults who live what they teach. Not a clever program that happens to work — following Christ, measured by outsiders, over decades.
The steelman, at full strength. Selection and composition: stable, married, sober families score higher on flourishing whatever their theology — maybe the Church attracts flourishers rather than producing them, while strugglers exit the denominator. Correlation isn’t causation. The happy-face critique: a positivity culture may teach members to report happiness they don’t feel. And the global health-axis nuance is genuine.
The weighing. The “confounders” — intact, praying, sober families — are the outcomes the faith is designed to produce; a cause the practice itself creates is not a bias, it is the fruit being measured. On causation: correct, and never claimed — but the 22-country attendance gradient, the longitudinal youth tracking, and the four-generation transmission data are three different kinds of evidence running one direction. On the happy face: one mask would have to fool depression screens, parent-relationship measures, third-party interviews, four-generation studies, volunteer-hour counts, and two million phones. What survives is humility — averages, not guarantees; direction, not proof; nuance reported, not hidden. What does not survive is the dismissal.
The Honest Verdict
FAQ
Are Mormons actually happier than other Americans?
Is this just the Church’s own research?
How many people actually leave the Church?
Don’t Mormon teens have worse mental health?
Why do Latter-day Saint families keep their faith at higher rates?
What are the honest limits of this data?
Sources & Data Ledger
- Global Flourishing Study (Harvard/Baylor/Gallup/COS; Waves 1–3, 2024–26) — per Justin Dyer, Deseret News, May 17, 2026. verified
- Smith & Denton, Soul Searching (Oxford, 2005); NSYR n=3,290 + 267 interviews. verified · family-practice percentages pin to pages
- Kenda Creasy Dean, Almost Christian (Oxford, 2010), ch. 3 “Mormon Envy.” verified
- Smith & Snell, Souls in Transition (Oxford, 2009). verified at stated phrasing
- Pew Religious Landscape Study 2023–24 + BYU Studies, “Latter-day Saint Trends in the United States” (June 2026 — via Church News); daily-prayer detail. Reconfirmed and extended by Pew, “Tradition and Change Among Latter-day Saints in the U.S.” (PDF; Evans & Leppert, Sept 22, 2026; doi 10.58094/a124-c097). verified
- Retention analyses — Pew, “Tradition and Change” (Sept 2026; official trend 70% → 64% → 54%, 28% of raised-members now unaffiliated; retention-by-tradition context); Dyer, Deseret News (Dec 2025 / Apr 2026 / Aug 2026 — locate article URLs); Deseret News data aggregation, Sept 22, 2026; GSS; 2025 LDS Religious Seismology Survey. Coverage: Riess, RNS “9 ways,” Sept 22, 2026. verified
- Dyer, Goodman & Wood, BYU Studies Quarterly 61:3 (2022; n=86,346) + Bowling Green replication (2021). verified
- Devin Pope, “Religious Worship Attendance in America: Evidence from Cellphone Data”, NBER Working Paper 32334 / U. Chicago Becker Friedman Institute (2024). verified
- Bengtson, Putney & Harris, Families and Faith (Oxford, 2013). verified, caveats carried
- Cnaan, Curtis & Evans, “Called to Serve” (U. Penn, 2012; n=2,664). verified
- External-link slots still open (verify before adding): Oxford catalog pages for the four books; Penn “Called to Serve” study page; Dyer’s individual Deseret articles; Pew’s Sept 2026 education analysis for the education-religiosity pin. Pending pins before annual refresh: Pew religious-knowledge releases; fertility/family-structure tables; Dean p. 20 verbatim quote; Souls in Transition closeness-to-God tables. ledger